Raconteur Data Visualisation and Infographics, The Times & The Sunday Times
Our infographic dashboards are created with one goal in mind: to present information effectively and clearly. Each piece is developed through a well thought-out process of data analysis and interpretation, prototyping of the space and illustration.
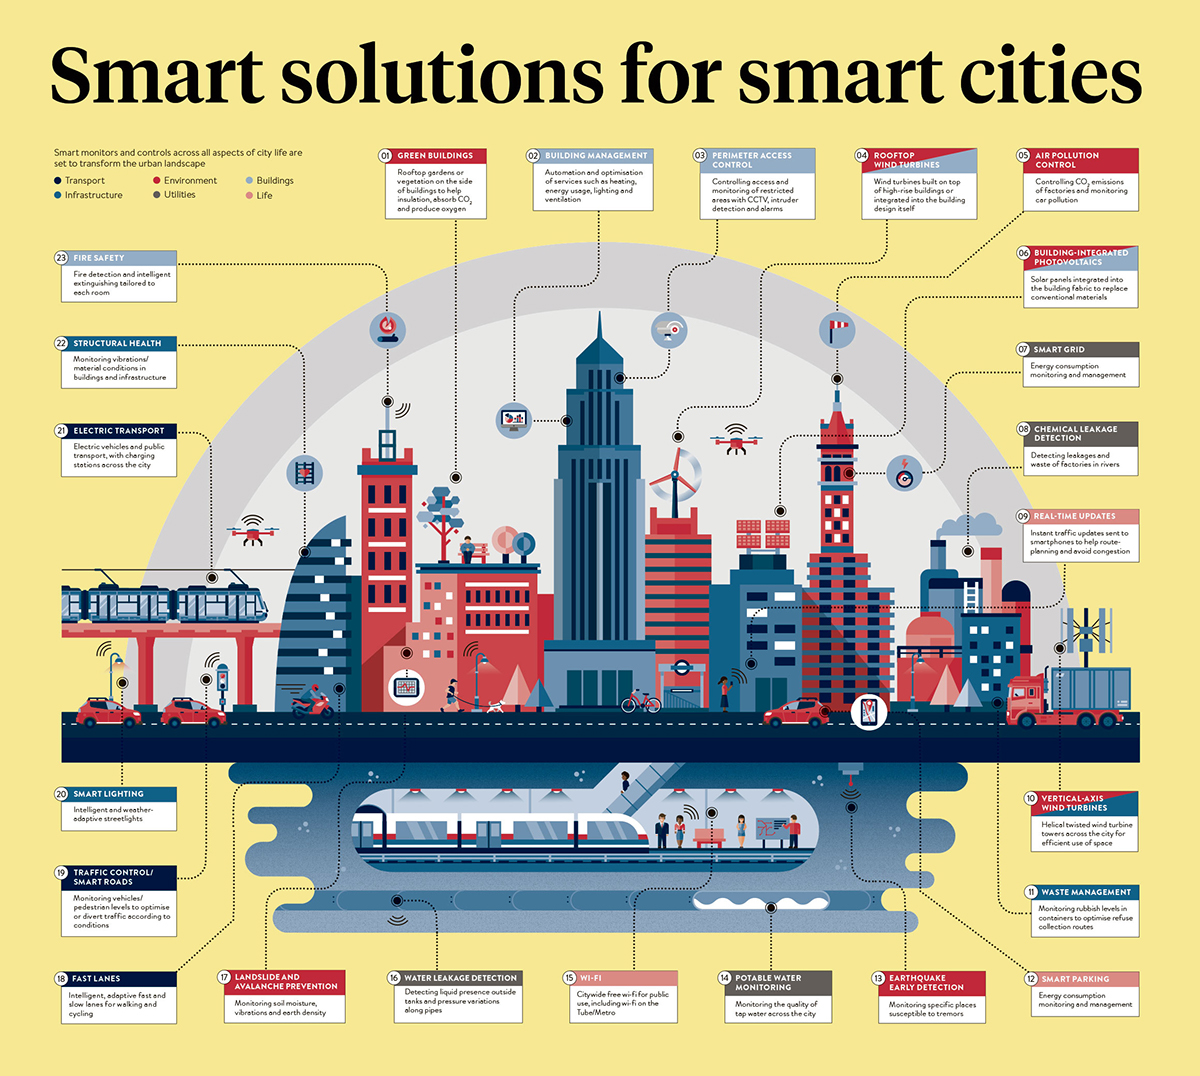
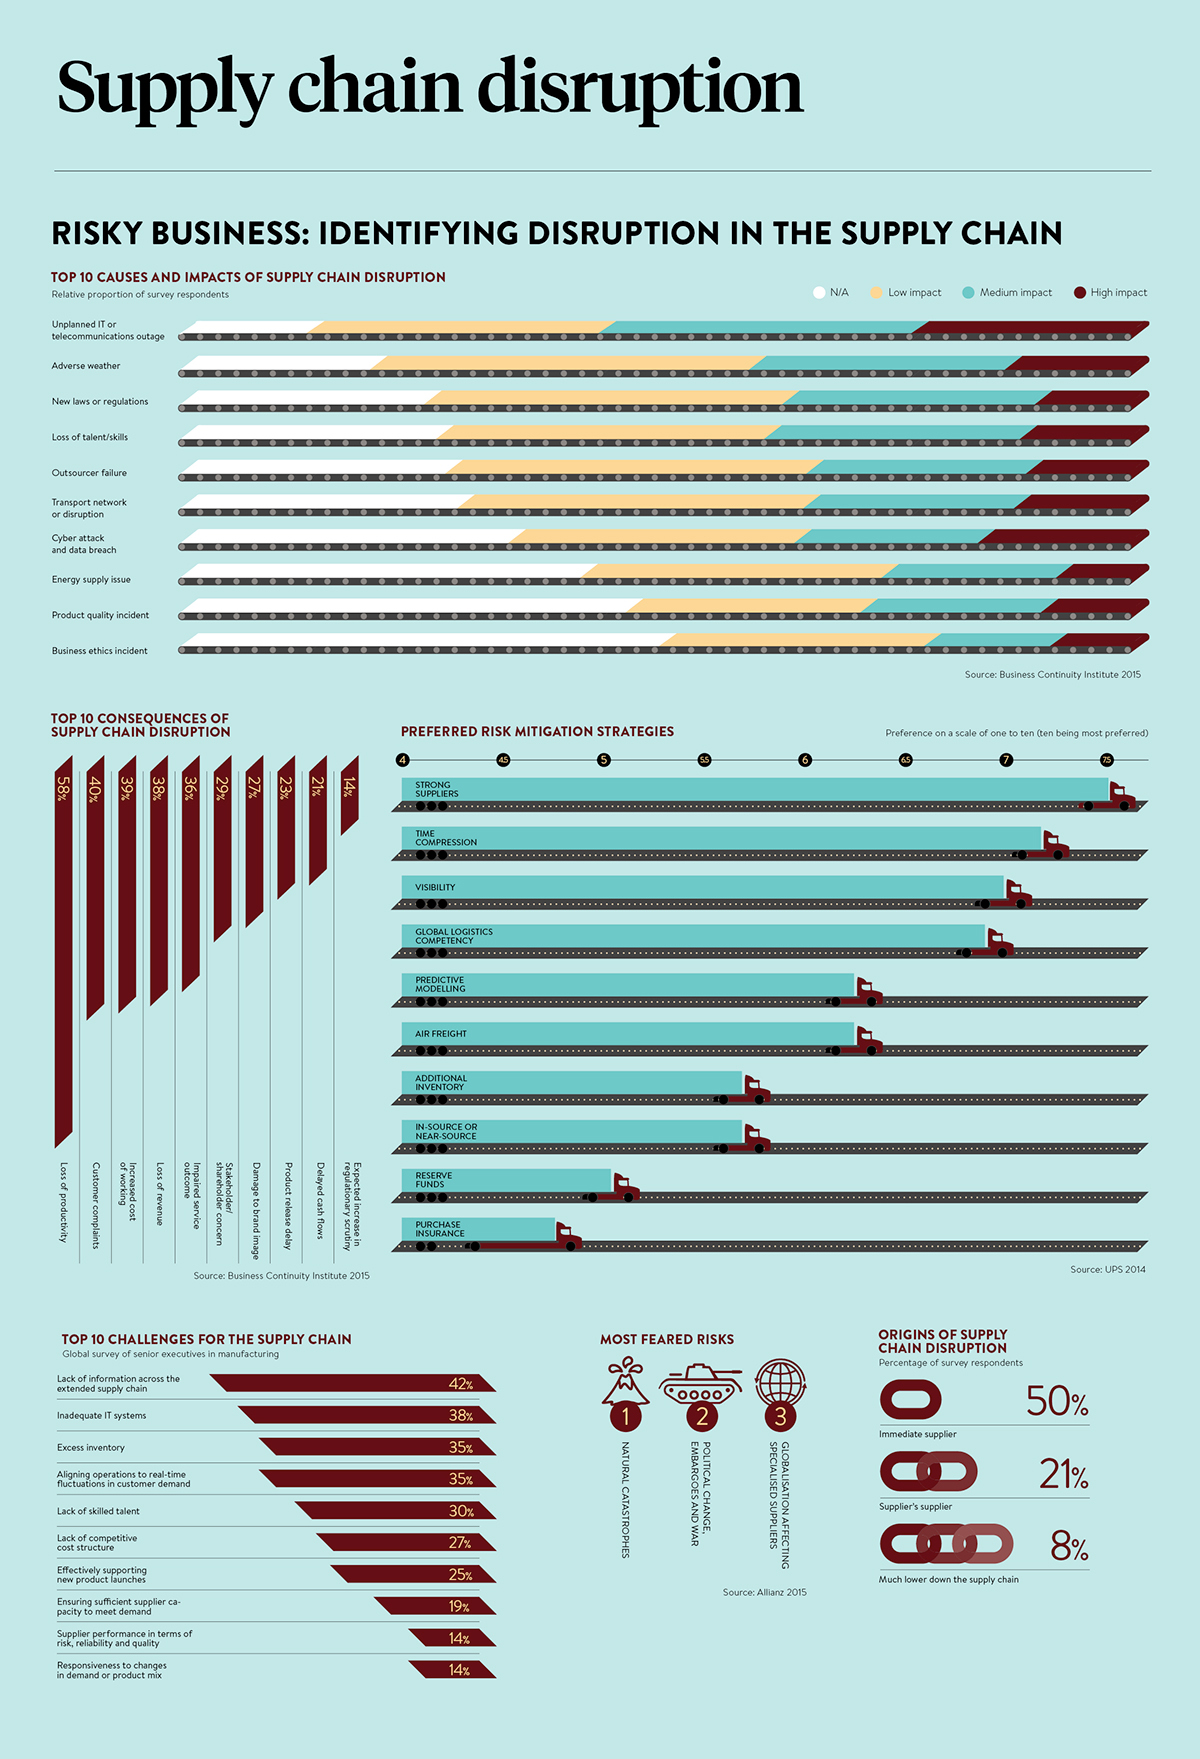
In every special interest report we publish for The Times and The Sunday Times newspaper, a dashboard is used in the centre-spread to present one main idea that is being editorially approached in the supplement. Raconteur’s interpretation of the data and the theme is unique and our style has been constantly evolving, a fact exemplified in these examples published here.